The story so far: 3 blog posts ago I introduced a web site which offered the new option to buy drinks and snacks in advance for a cinema visit. This is an imaginary web site. Why should you need an extra drink? For the desert scene in Monsters Unlimited. Also imaginary stuff.
1 blog post ago an anxious project leader dropped by for a performance test for the next day. Somehow it ended up as a cliff hanger for … [Some dots] SFDIPOT in performance test.
Now I can continue to write about my standard talk for project leaders about performance tests. Let me add some flavour. Stirred, not shaken.
SFDIPOT is basically used to determine new angles. Up till now I have not used it for performance test. I could make a rough picture about the system. Why not? Visual testing anyone?
This is Structure. What are the building blocks?
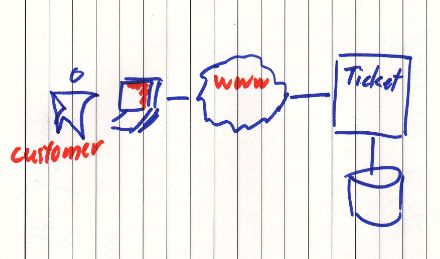
The customer uses a web site to buy tickets. There is an extra module to handle orders of drinks and snacks. So an extra flow is added.

Decades ago I would be happy with this picture. But I know now that I would miss important information.
Now I have a look to the Function or what the system is expected to do.

“Hey, what’s that?”
“The marketing department is keeping a close eye on revenue.”
“I understand that they want to increase it, but this can impact the performance of the system.”
“You are right, so analysis takes place outside this system.”
“Okay.”
“But the counters are inside the system.”
“Sure enough.”
Another way to look at functions is to visualise it.
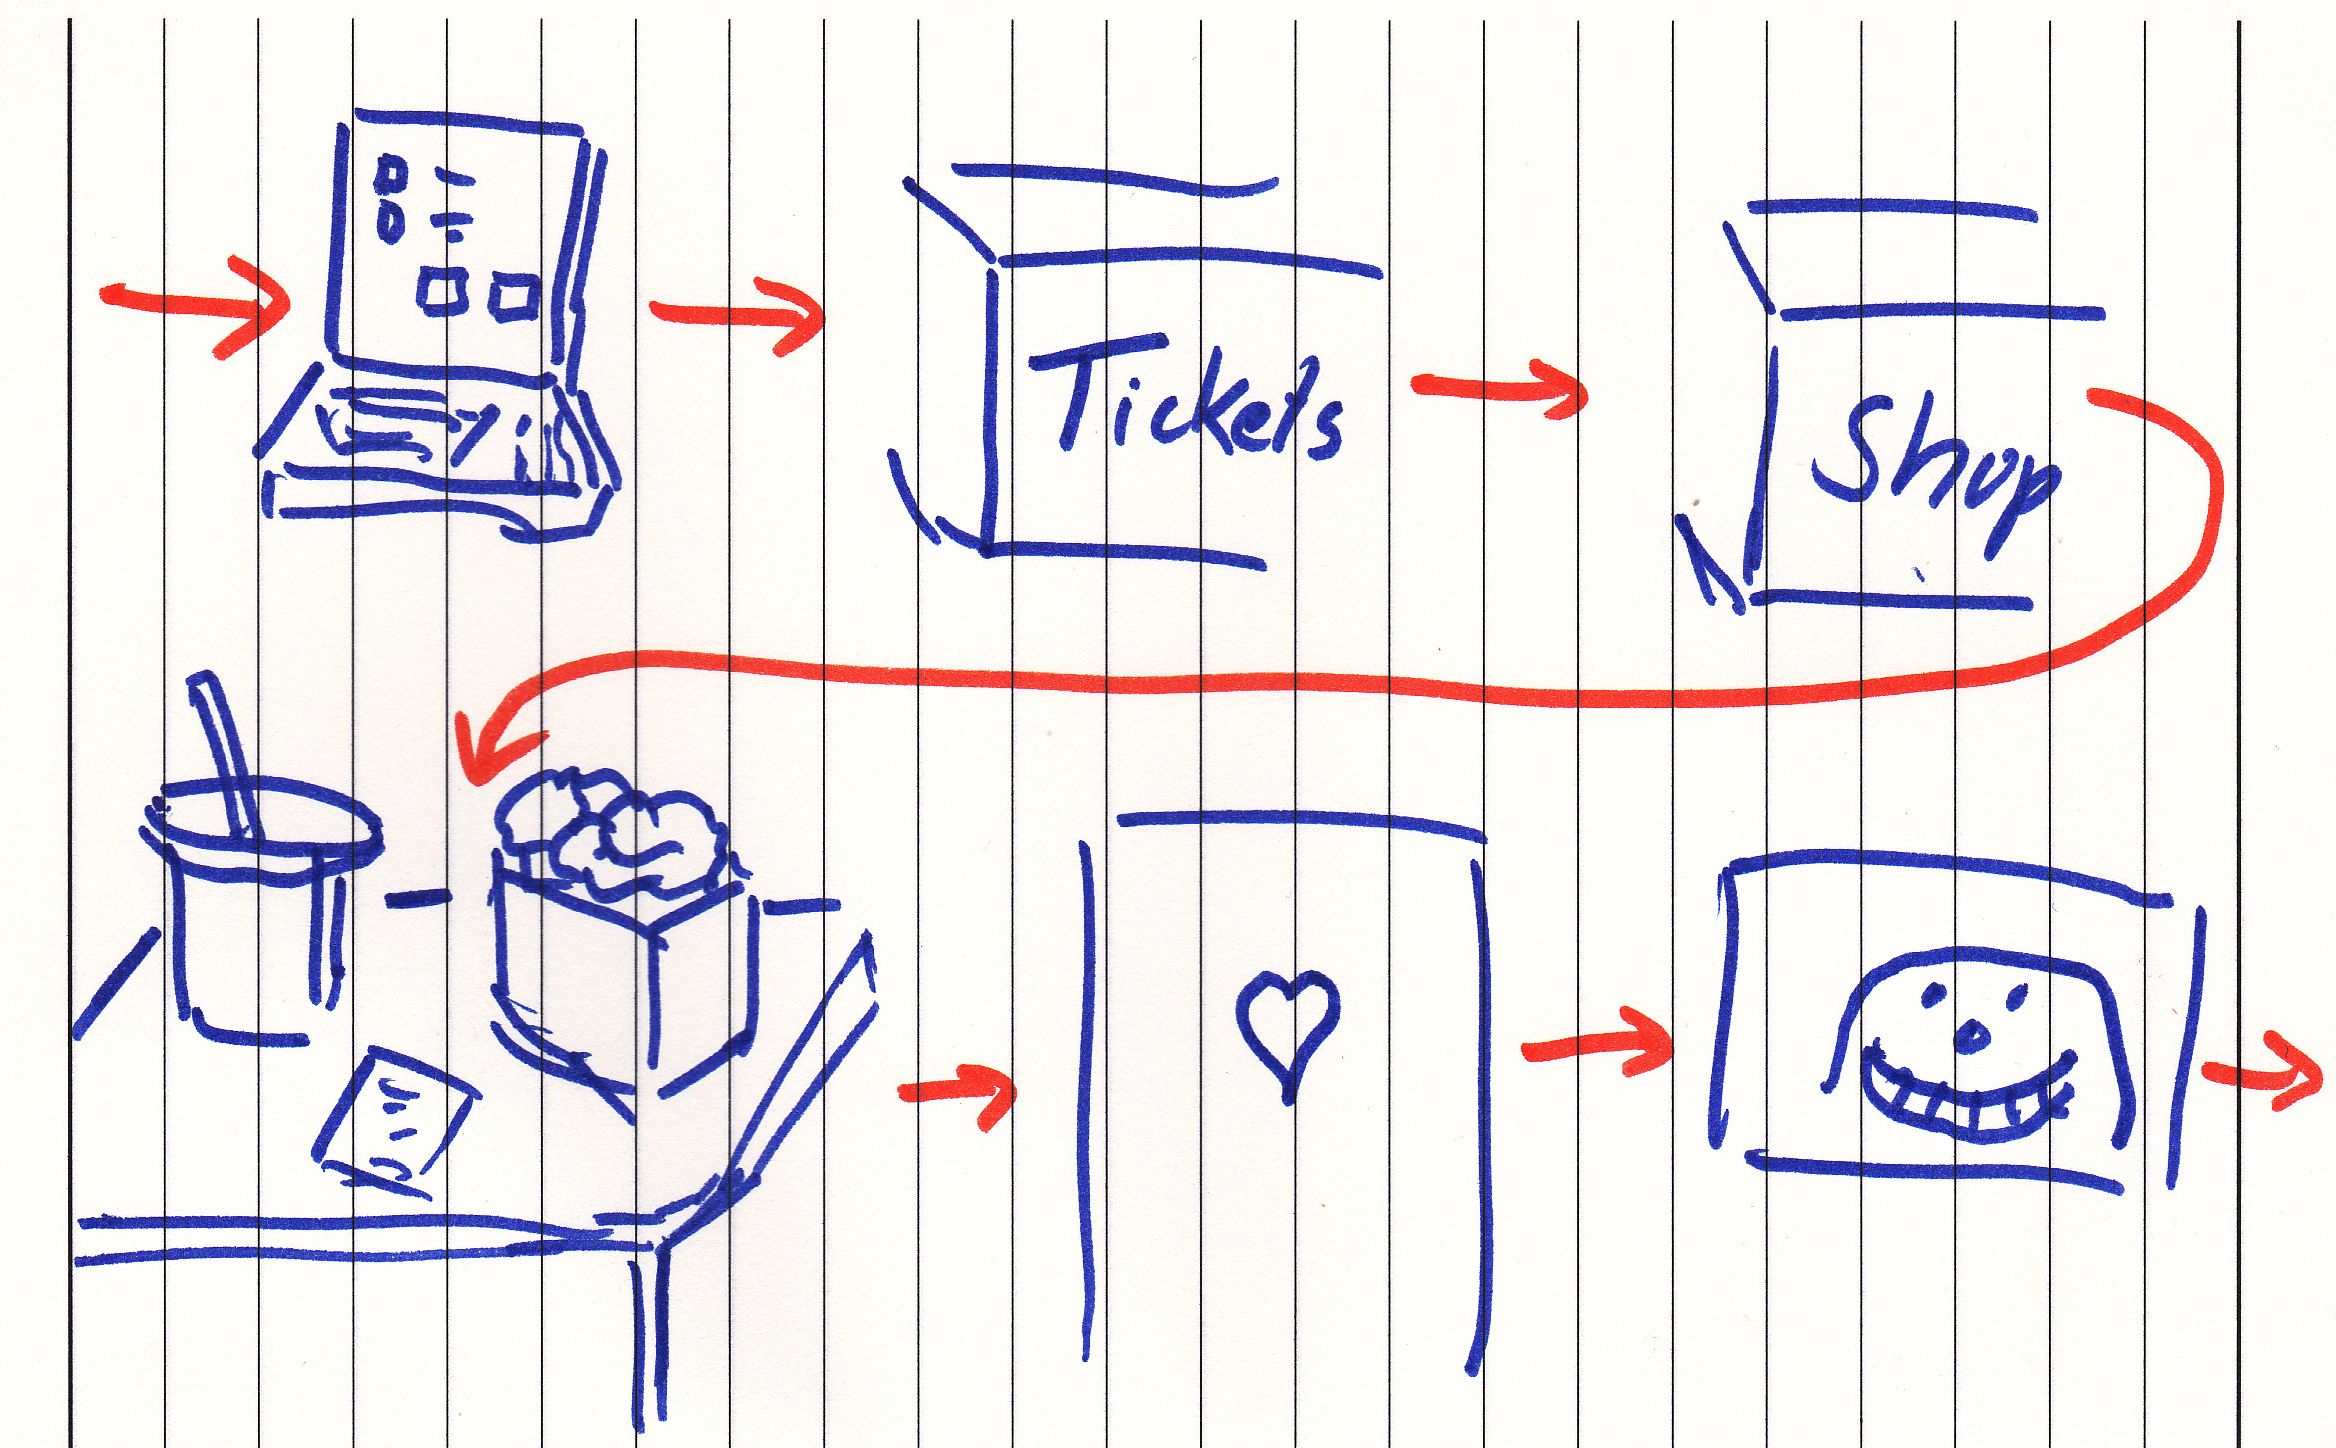
”Okay I do understand the pictures, but what is that rectangle with the heart?”
”It is the toilet.”
”But it has nothing to do with web site.”
“But it can impact the cinema visit. (: P)
This picture offers another perspective. You might call a visual user journey. ”
Data is all the information which exchanged in the system.
“You probably have a link to the purchasing department.”
”Yep and this one is also handled outside the website.”
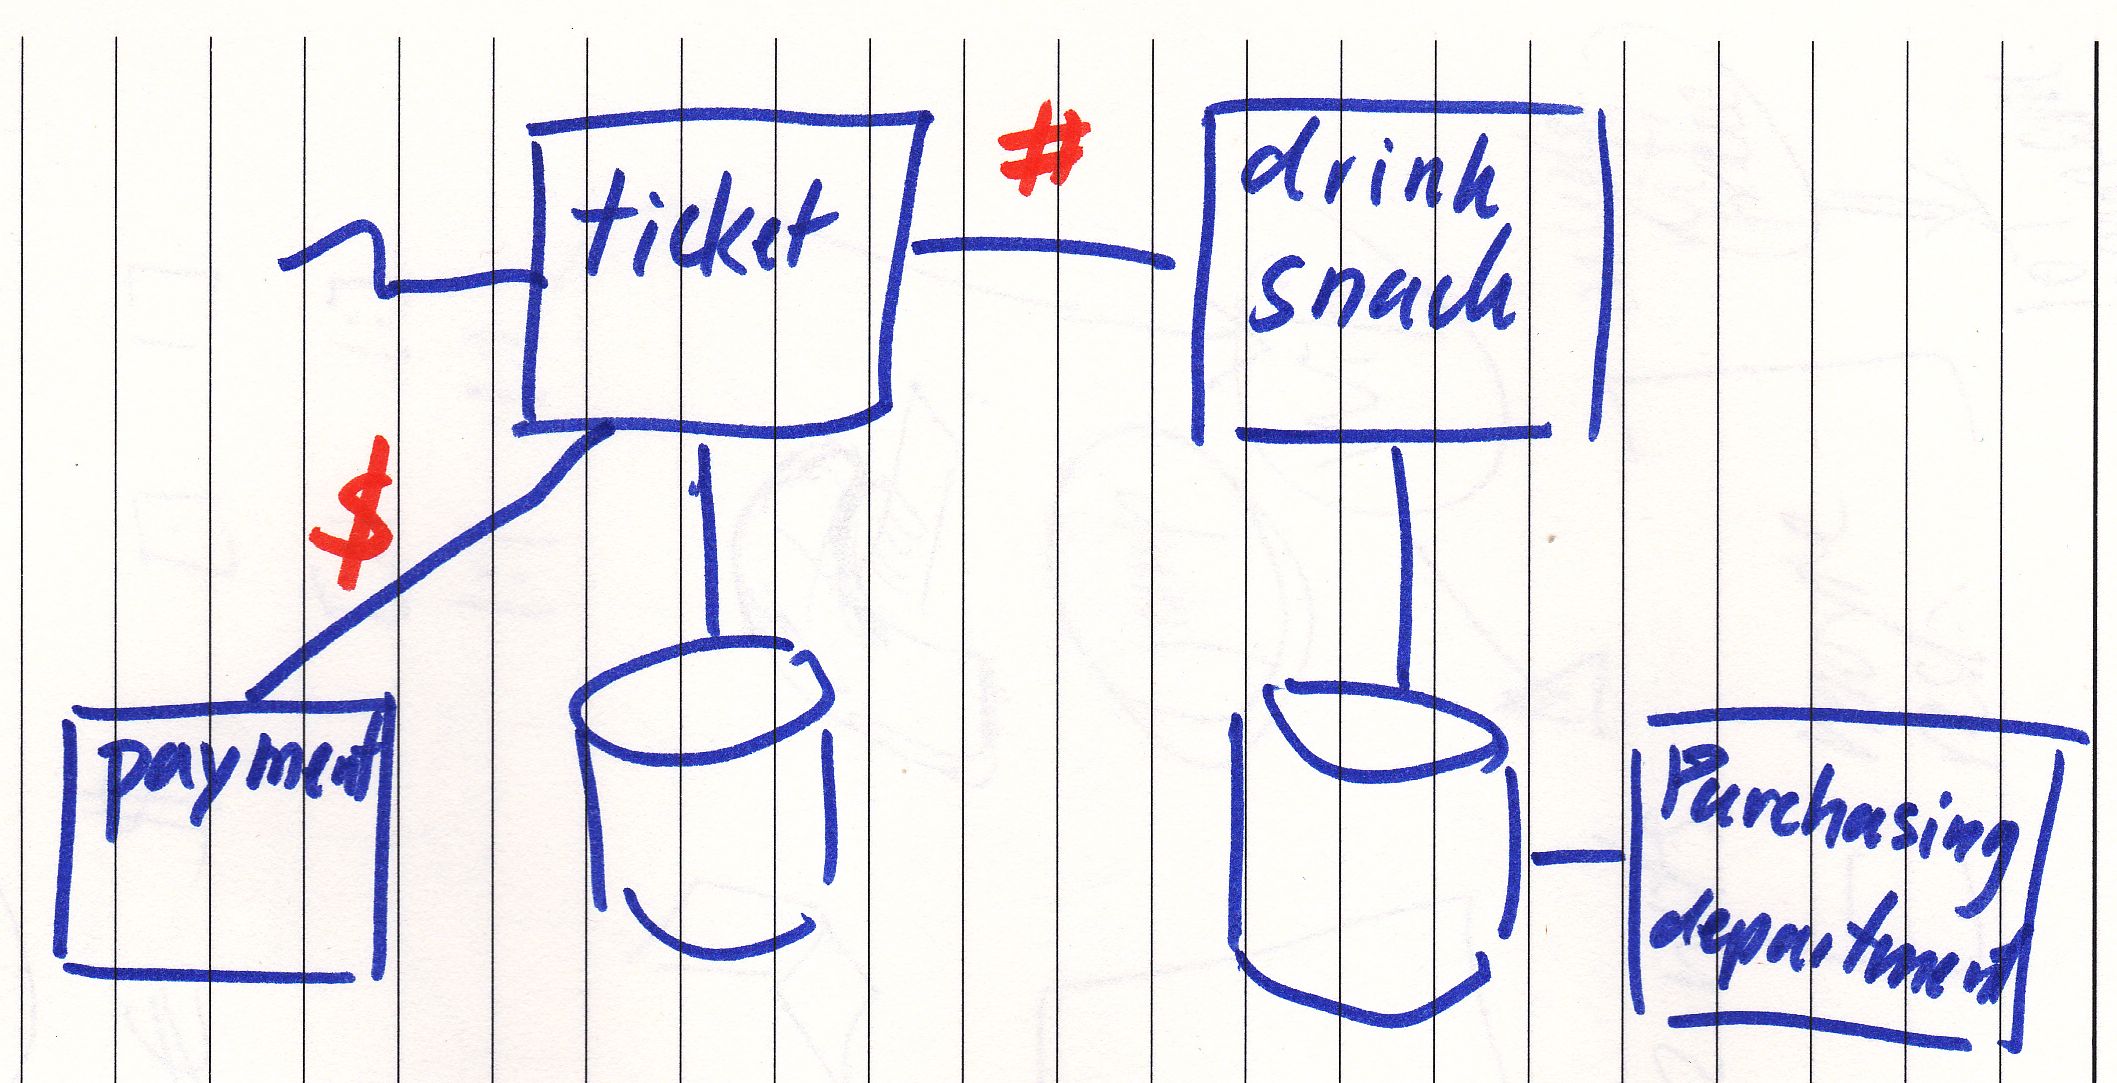
”If I zoom in, I see tickets, drinks and snacks going this way. It’s first just raw data.
I miss some money. ”
”That is no problem. A supplier takes care of the payments. ”
”Ok.
What about all those snacks and drinks? ”
”Those are bar codes and numbers.”
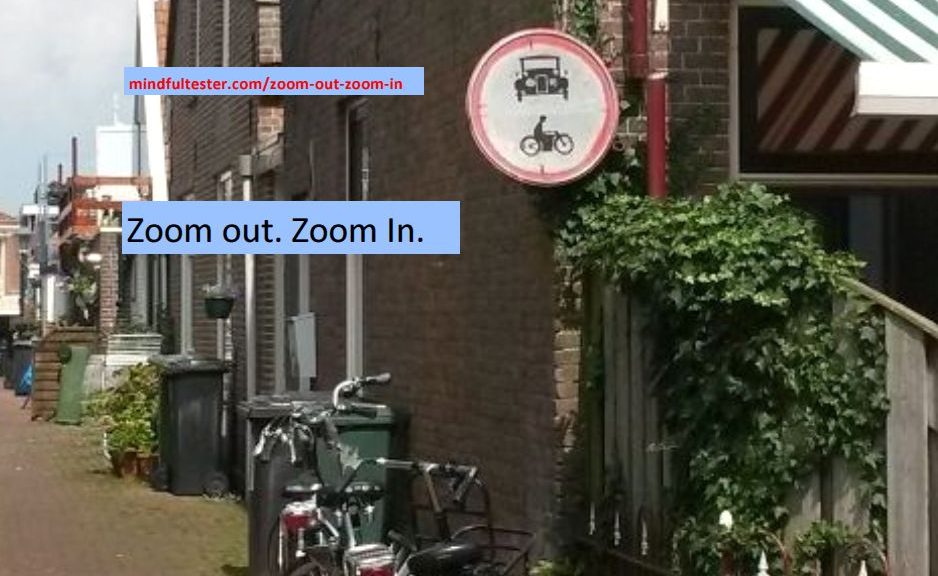
Interfaces are ways to interact with the system. So …
”I am curious whether the system can handle streaming film trailers.”
”Sure no problem. The web site has two servers: one is completely dedicated for streaming. ”
”Do you have free WiFi?”
”Sure, but …”
”What happens, if a lot of visitors start to watch a movie trailer on their mobile?”
”Wait. You are telling me that my internal network could be slower. I did not think about this option. We need to take measures like a separate network for visitors. ”
”Yes.”
”How did you figure this out?”
”I was thinking very fast.
Like . ”
”Could you please slow down?”
“# $ €
|:| |:|”
”Man, you think fast. Let me see: # stands for numbers, €$ for money and |:| |:| for … ”
”For movie. ”
”Okay. I know a lot of symbols, but this one is new. ”
”I just figured that one out.
In the past films were on celluloid rolls. There was picture and some holes to transport the roll. : are the holes. You know like this. ”
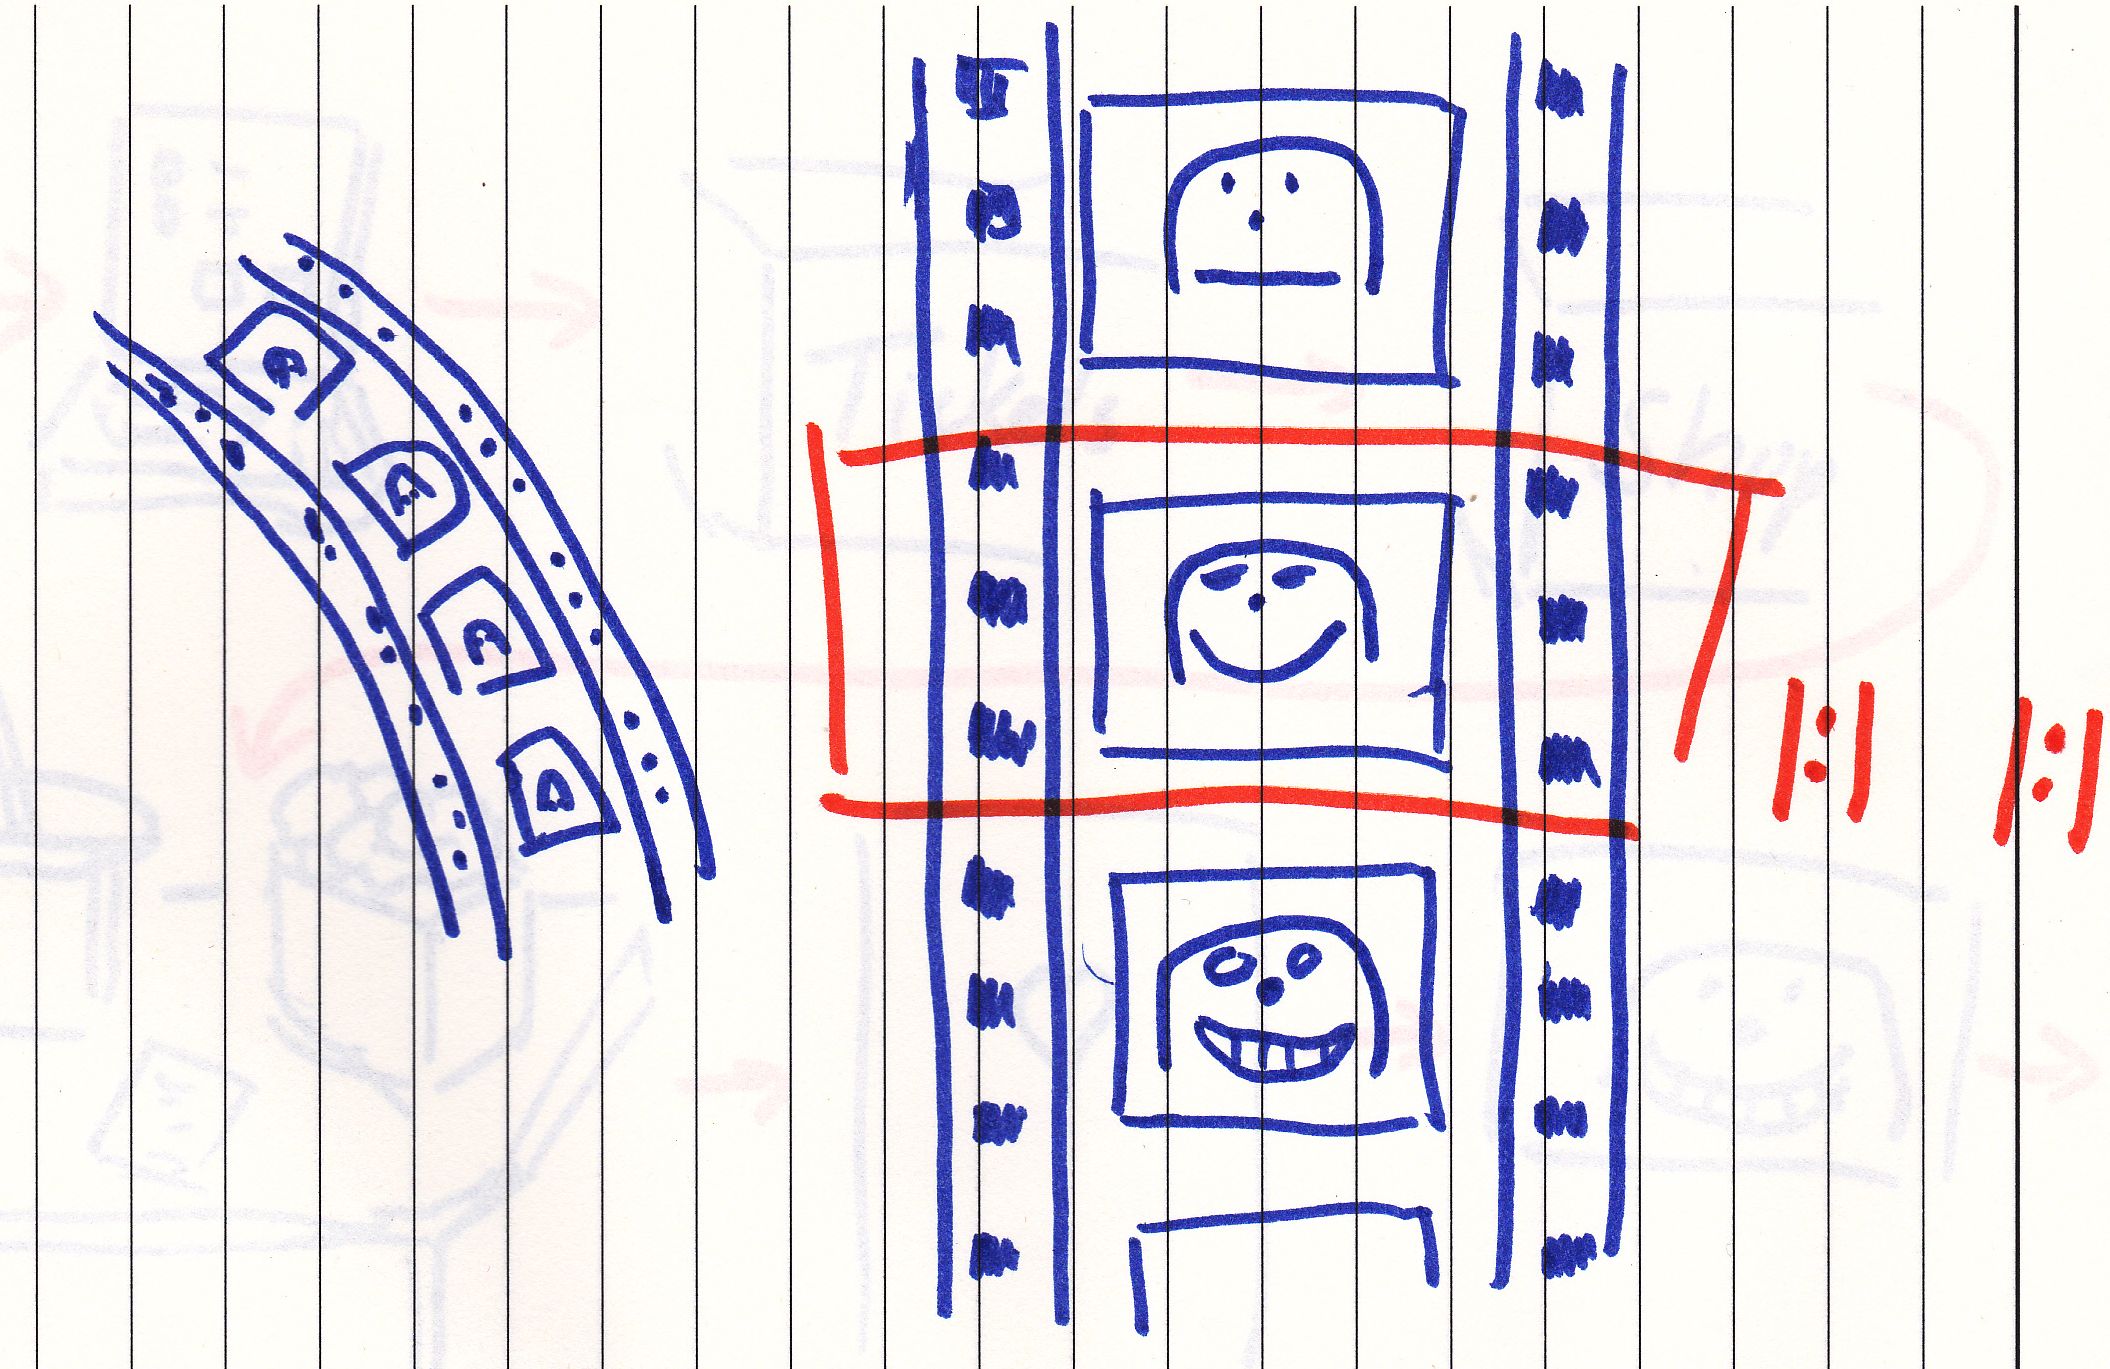
”I still not get it.
How did this image popped up? ”
”I looked to my user journey.
So my customer has picked up a ticket, drink, and snack? What can she or he do?
This.”
[Hand moves to a pocket and takes out a smartphone.]
“Wow.”
“That’s why it is so important to use multiple senses to plan a proper test.
This movement [hand collecting phone] is muscle memory. ”
Now we have a look at the platforms or where is the system used?
“No problem. The web site and the connected systems work on one platform. It is used frequently. Known technology.”
“But the browsers can be used on smartphones and tablets with different browsers and different operating systems.”
“This is also known technology.”

Operations is about how the system is or will be used. This could lead to the following plausible talk.
“After our last talk I talked with the marketers. They noticed the following patterns:
- Most tickets bought in advance are sold at least one day in advance.
- Most tickets bought in advance are sold for the weekend.
- The week patterns are almost the most same in the month except for the first week. “
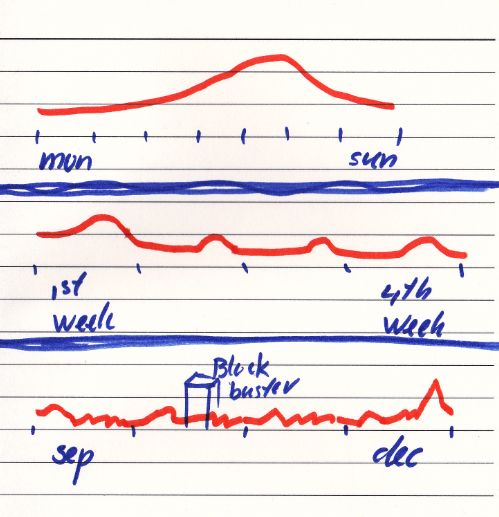
“First week. Can you explain it?”
“Salary is paid in the last week of the month. People pay more for entertainment, if there is more money on their bank accounts. ”
“Of course there are exceptions on the months. December and the summer months are way higher because of the holidays. Watching a movie is a nice way to spend holiday hours.
There are of course still unexpected and expected mega ticket selling movies.”
“Do you also take discounted movie tickets in account?”
“Yes, this lead to some increases. About 5 to 10 percent.”
“I would suggest to use the December holiday as the standard load profile. This way the system can handle peaks. To be sure a percentage of 10 % is added.
“Is your customer also interested, when the system breaks down?”
“We already took precautions: the modules for the tickets, drinks, and snacks are placed in the cloud and their resources are automatically scaled.”
“So everything is covered.”
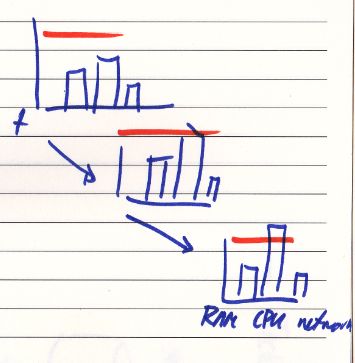
“It looks good. It is important to know which factors have a major impact on the performance like CPU or chip, RAM or memory and use of network.”

“Of course you are interested in the change of use of the resources.
“You go to the ticket counter. You get a ticket for the movie and vouchers for snacks and drinks.
If I look to the user journey I miss a step between the ticket counter and the shop counter?”
“Wait the lines are wrong, it should be like this:”
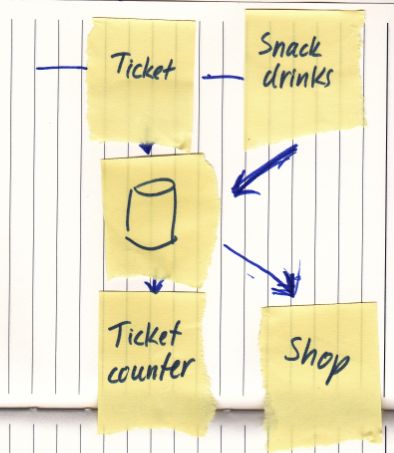
“The ticket counter should have access to the drinks and snacks ordered.
“Okay I update the pic later.”
“If I go with 5 excited kids, I end up with 6 movie tickets, 6 snack vouchers and 6 drink vouchers. Double the number of drinks for Monsters Unlimited with the desert scene.”
That is a lot of printing.
So I have 24 cards. This is bigger than the set of business cards I end with after a conference. And the set of followers on Social Media. Todo cursive.
So the network can handle the extra information for the printers.”
“Yes, it is insignificant number of bytes.”
How much time does it take to print ’em all?”
“0.5 sec a ticket.”
“So I have to wait 12 seconds.
Wait 180 people go to a movie. That makes 4 x 180 pieces of paper in worst case (1 movie ticket, 2 drinks, and 1snack person). Only the printing will take 4 x 180 x 0.5, which makes 360 seconds. That is exactly 1 hour.
Of course people will not arrive after each other, but like this. If I add the number of voucher for drinks and snacks, I get …”
“Could you please stop?”
“Did I do some miscalculation?”
“No. I remembered something else. It took us months to determine the right number of ticket counters. My customer had to increase the number of counters. In this case it would be by 4. That is not pretty.
This is out of my scope. I am only responsible for IT.”
“Printers are also IT. The system is not a single web site. Look at the pictures.
You might consider to reduce the number of vouchers. There is enough room on the paper for other things.”
The following item of interest is about the relationship between the system and Time. Yes finally.
A few months ago there was a question about ambiguous requirements. As a performance test coordinator I often heard: “It is fast enough.”
My solution was to perform a performance test on the old and the new system and compare the results.
Sometimes I was lucky and I had some real acceptance criteria. Like 95 % of the response time of function X is under 20 seconds. And a completely filled web site. The same content might give the same response. Or the other way around: almost no content is almost no delay.
“Now let me look at the response times. In the current system these are the response time for the tickets page, the payment module, and the ticket counter.
That payment module is swift and it is outsourced.
For the drink and snack page and the shop counter the times are added. Notice, that there is night between the day and the cinema visit.
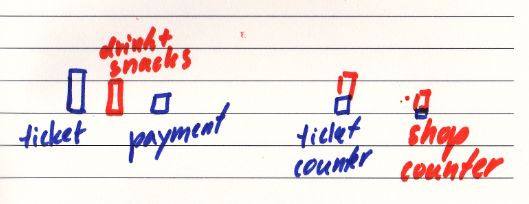
I can add the numbers for one movie. Then I get these numbers Fir two movies on an evening there is reassuring low response time.
“Let me guess your system is fast enough to handle a blockbuster evening.”
“You bet.”
“I don’t take bets I can lose.
But what about this?
Snacks and drinks ordered in advance are collected by the cinema people.
There is probably an acceptance criterion that snacks and drinks can be collected by the customer within 2 minutes after collecting the ticket.
So if I come with 5 kids collecting 6 snacks and 12 drinks, someone has to be quite fast. But there might be more people needed who collect their drinks and snacks.”
“That will be a problem. But I am only responsible for IT.”
“What about the people who have to work it. And your customer who depends on order drinks and snacks in advance page?”
“One apple juice please.”
“Huh. Oh yeah, you won the bet.”
“No, I am thirsty after all that talking.”
“You ain’t seen the desert scene of Monsters Unlimited.”
[Small update: there is a Q&A a few blog posts later about this very blog post. You can even join the party.]