[Note from the author: after some fact checking I discovered that I used the Red Card in a wrong way in this blog post. The red card must be used to raise issue like low volume or high temperature in the room, which can lower the quality of the gathering of information. For normal interruptions the yellow card should be used.
This basically means that I had to rewrite the blog post on certain points. This task was more complex than I had expected. The whole flow of arguments had to be restructured while preserving the spirit of this post. So I only added this note.]
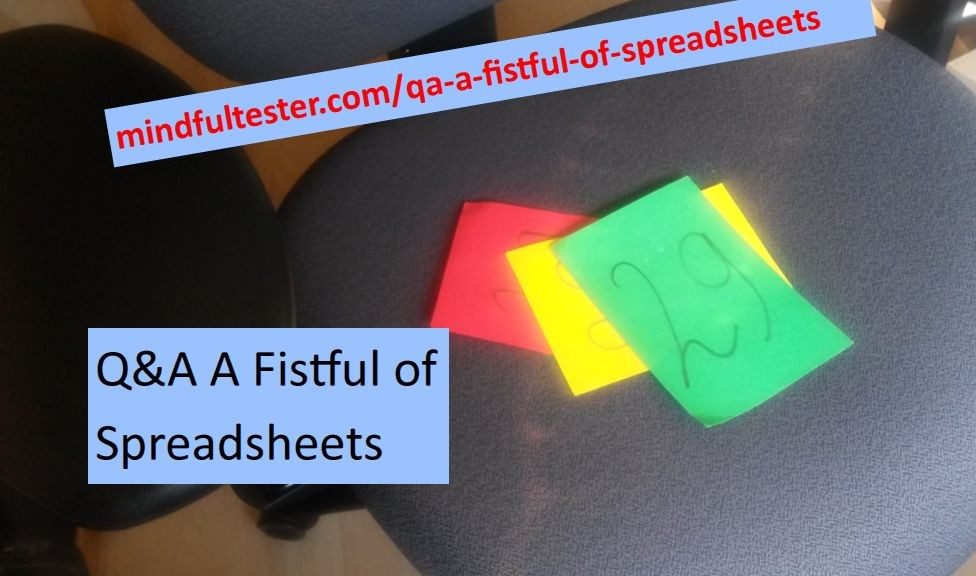
Facilitator: Welcome back to another round of questions and answers. This Q&A will focus on the serie Smart Use of Spreadsheets of Mindful Tester. K-cards will be used in order to structure the flow of thoughts.
I’ve got green cards from numbers 43, 25, and 9. Number 43, you can ask your question.
Attendee number 43: I only read instructions. Why do you not add more clarification?
Writer: It is important to discover things myself. This way I get a better understanding of spreadsheets. In this serie I wanted to share this experience with you, the reader.
Facilitator: I’ve got yellow cards from numbers 31 and 16. Number 31 it’s your turn.
Attendee number 31: That’s pretty abstract. I don’t get that. Would you provide an example?
Writer: In the last episode I described the use of Remove duplicates in order to get a set of pizza brands or a list of names, which are mentioned only once. During the test I needed a way to make a set. I explored the spreadsheet program to find an easy way. By letting the reader follow my steps she or he might see some functions of spreadsheets, which are unknown and useful in the future.
Facilitator: Number 16.
Attendee number 16: How did you find it?
Writer: By selecting a tab, which might contain an interesting set of functions.
Attendee number 16: Just curious. Did you know the function before the test?
Writer: No.
Attendee number 16: So you stumbled upon it during the test?
Writer: Yes, I did.
Attendee number 16: Is it not strange to start testing without an exact set of instructions?
Writer: No. Let me elaborate.
Attendee number 16: Sure.
[Facilitator relaxes.]
Writer: Is it possible to make a test strategy, which does not change? I think: “Not”, so making test cases should be postponed as long as possible or skipped when possible. Nothing is worse than hours spent for nothing. The same is also applicable for the use of tools to determine the most easy way to test the system under test.
Facilitator: A yellow card from number 33. Number 33 it’s your turn.
Attendee number 33: When do you skip test cases?
Writer: There are other alternatives like checklists and exploratory testing.
Facilitator: this is going off topic, so I am closing this thread.
I’ve got green cards from numbers 25 and 9. Number 25, you can ask your question.
Attendee number 25: In your blog post you are using a spreadsheet program. Why did you not use a database tool or Python? They are better equipped to handle data.
Facilitator: I see a red card from number 493. You have a question about the question?
[Attendee number 493 nods.]
Facilitator: Number 493.
Attendee number 493: what is Python?
[Facilitator looks for a snake.]
Writer: For me is Python a strong light weight programming language. Do you need more information?
[Attendee number 493 shakes his head. Facilitator relaxes.]
Writer: The question was: “Why did you not use a database tool or Python?”I have to take additional steps: install tools and figure out, how to use them. It would have taken me extra time.
Facilitator: I’ve got yellow cards from numbers 1 and 24. Number 1 it’s your turn.
Attendee number 1: This could have been a nice starting point to explore another tool?
Writer: Yes, but… The but is to look for long term benefits. For simple data manipulation spreadsheets are good enough. I did not expect complex data analysis in the near future, so I did not even consider using other tools.
Facilitator: Number 24
Attendee number 24: why did you not use the experience report to tell your story? This would provide more insight in the way you work.
Writer: it is nonlinear and it would confuse the reader, who is looking for a fast and linear solution.
Attendee number 24: Could you be more specific? I mean: could you share an experience?
Writer: The first time I used Remove duplicates I got the wrong combination of pizza brands and phone numbers. So I did a manual check for the remaining wrong numbers. Later I discovered that I ordered the phone numbers from A to Z instead of Z to A. So I used System 1.
Facilitator: I see a red card from number 493. Number 493.
Attendee number 493: what is System 1?
Writer: System 1 is used for automatic and fast decisions like walking to the supermarket. System 2 is used for the complex operations, which need thoughtful thinking like buying items on the shopping list.
Attendee number 24: So?
Writer: When I heard the word Order, I picked the order from A to Z. For System 1 this is the default choice. I had to use System 2 (Is the order really from A to Z?), before continuing the test. Adding this experience is likely to add confusion for the reader.
Attendee number 24: I think that you are smart enough to make a smart formula to automate the manual check.
Writer: Thank you for your compliment. There were only foursome numbers to check. I actually made an attempt to use a formula, but that costed me too much time.
Facilitator: Are there any more questions on this thread? Apparently not.
I’ve got green cards from numbers 9, 10, and 11. Number 9, you can ask your question.
Attendee number 9: Why did you not use a programming language supported by the spreadsheet program?
Writer: I didn’t know the language.
Facilitator: Number 10.
Attendee number 10: Why did you not use a blink test to compare?
Facilitator: I see another red card from number 493. Number 493.
Attendee number 493: what is a blink test?
Writer: A blink test is a test, during which the tester processes a lot of information in incredible short time or in a blink of an eye. In this particular case you can switch fast between the two spreadsheets. Differences can be noticed: characters change.
[Attendee number 493 nods.]
Writer: The blink test has some disadvantages. Spreadsheets can be so big, that you need a lot manoeuvring. Some spreadsheets have cells with default width, so not the complete content is shown to the tester. Non-readable characters can be contained in cells. My favourite is that trailing spaces cannot be spotted with the naked eye. “Text” looks the same as “Text<space><space>”.
Facilitator: Number 11. You can go ahead.
Attendee number 11: You copy the calculated values instead of the formulas to the last worksheet. [Speaker nods.] That is a smart move, but it looks like a redundant step to me.
Writer: if everything is OK, then you are right. It there is more than 1 NOK, then odds might change for me. In this case I have to verify the formulas. If they are right, then I have to analyse the data. Values can better be manipulated than formulas.
Attendee number 11: Like?
Writer: Spreadsheet programs support auto filter, which contains nice features.
Facilitator: I’ve got green cards from numbers 21, 562, and 23. Number 21, you can ask your question.
Attendee number 21: You already advocated against the use of database tools and programming language in this context. Why did you not use spreadsheet comparison tools?
Writer: It would only save me one step: to learn the tool. I have to admit that I am not familiar with these tools.
Facilitator: I’ve got green cards from numbers 562 and 23. Number 562.
Attendee number 562: Why do you not change the background colour of the cell to red, if the cell contains a NOK?
Writer: It is an extra step. For analysis of complex patterns of NOKs it can be considered.
Facilitator: Number 23.
Attendee number 23: I found a neat trick. If I have to compare a new sheet with one in the map, then I copy the sheet in the map and rename the tab. What about that?
Writer: It is a tricky one: after months it is not clear, which spreadsheets have been compared. More particular: what were the sources of the sheets? Also there is a risk of different numbers of rows. You actually have to refactor the spreadsheet.
Facilitator: A yellow card from number 21.
Attendee number 21: Could you give an example of refactoring?
Writer: I would an extra row above the table and add a text with information over the source. You still have to watch the formulas though.
Facilitator: A green cards from number 372. Number 372.
Attendee number 372: Why do you not use the standard compare function of the spreadsheet programs?
Writer: Good question. I’ll have a look.
Attendee number 372: Sounds like a new blog post?
Writer: The last blog post about spreadsheets took a considerable amount of time.
Attendee number 372: Why?
Writer: I was refactoring the solution.
Attendee number 372: Is that not contradictory with your previous statements about being lean?
Writer: You’re a smart girl. I blog in my free time.
Facilitator [a bit surprised]: I see a green card from number 493. Number 493.
Attendee number 493: What do you mean with “=b”?
Writer: “=” is an underarm and “b” a hand.
Attendee number 493: Thanks. =b.
Writer: Thanks.
Facilitator: Thank you for all questions about spreadsheets, testing, and… Hey, I miss the pizzas. Anyways I hope you enjoyed this Q&A.
Keep on questioning things!